These 2 reports will show you the percentage of your appointments and hours that are attributed to each referrer and the actual appointments over a specific time frame by referrer.
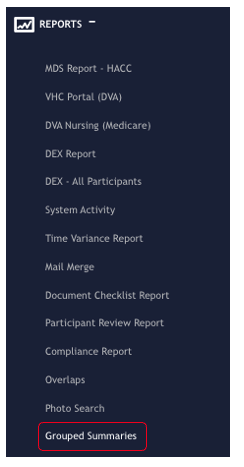
From the Eziplan Menu:
Reports - Grouped Summaries
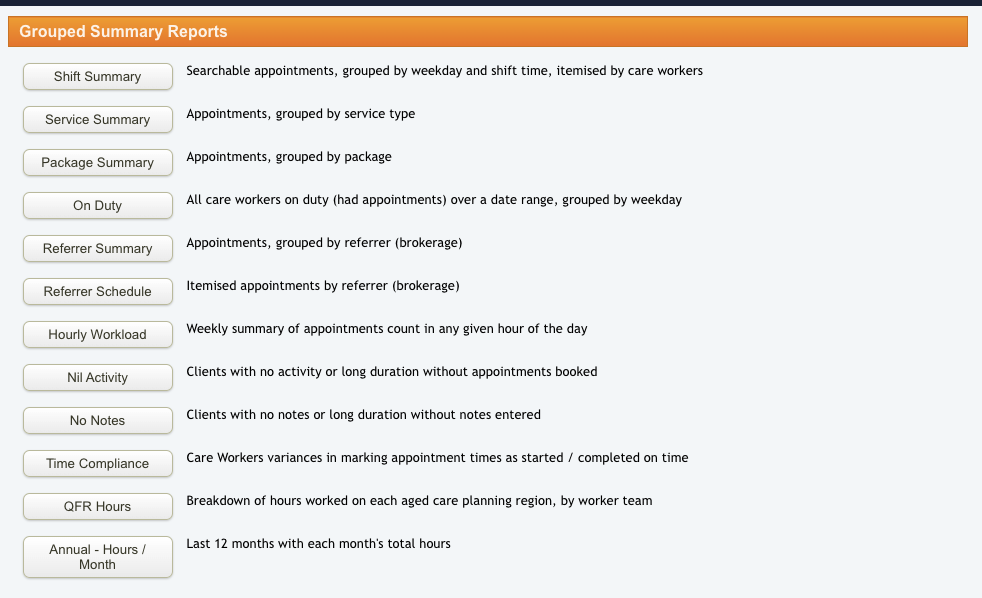
For appointments grouped by referrer, choose 'Referrer Summary'.
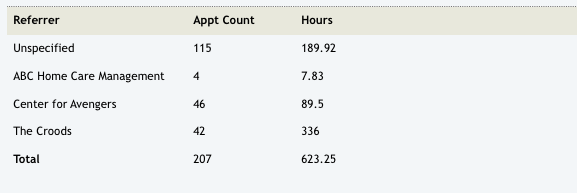
To look for referrer appointments on a specific timeframe, search option is available for you to enter the dates. Once done, the system will give you the results of all the appointments of the referrer in a pie chart by percentage.
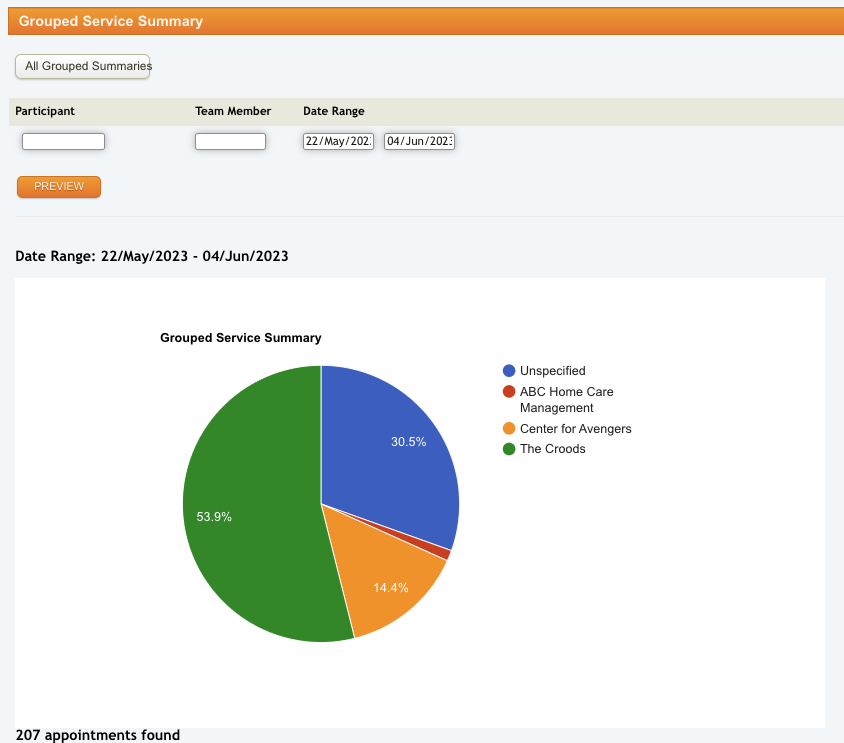
At the bottom is the total number of appointments found including the appointment count and the number of hours.
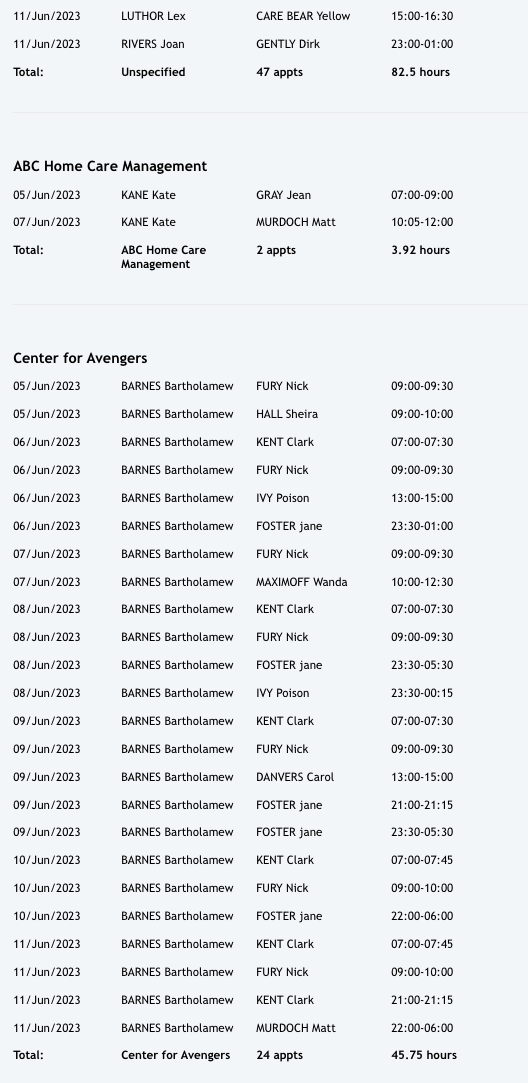
For the itemised appointments by referrer (brokerage), select Referrer Schedule.
Once in there, the page will initially show you the total number of appointments in the most recent week however, a filtering option is also available if you are looking for a specific Referrer, Client or Date Range. At the bottom of each brokerage is the total number of appointments and number of hours.