This report helps you analyze the amount of work performed by a care worker over a specific period. It offers insight into the number of hours worked at different times of the day, assisting in identifying peak staffing needs. You can access this from the Eziplan Menu:
Reports - Grouped Summaries
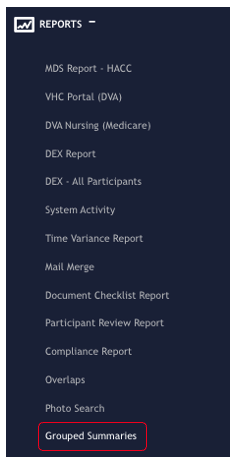
and select 'Shift Summary'
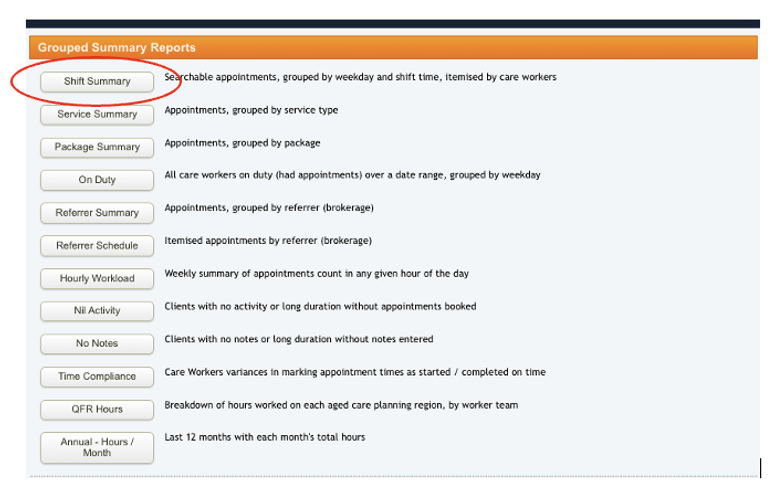
On the Shift Summary page, you can use the filtering options to search for summary data related to a specific Client, Care Worker, and Date Range. The data is organised by weekday and shift time, and includes a weekly average calculation. To export the report, simply click the Excel icon on the right side.

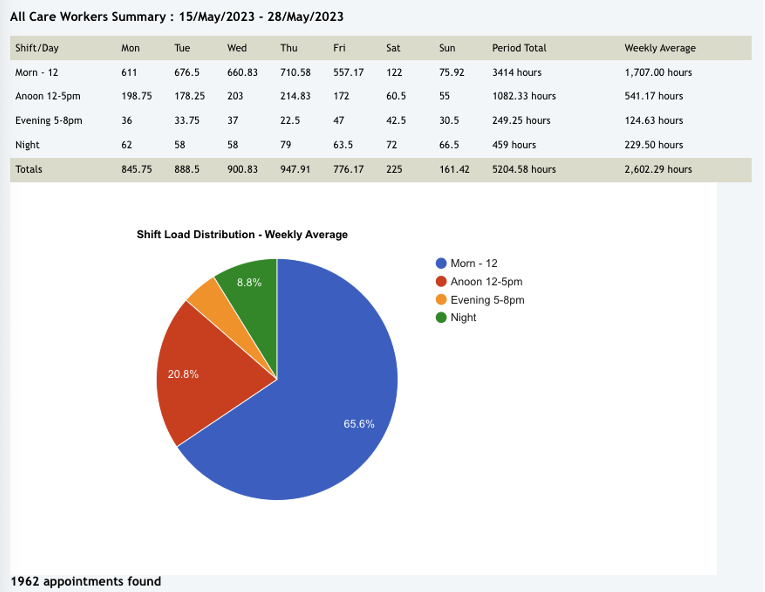
Weekly Average of Shift Load Distribution is shown in a pie chart where data is categorised per shift (Morning, Afternoon, Evening and Night).
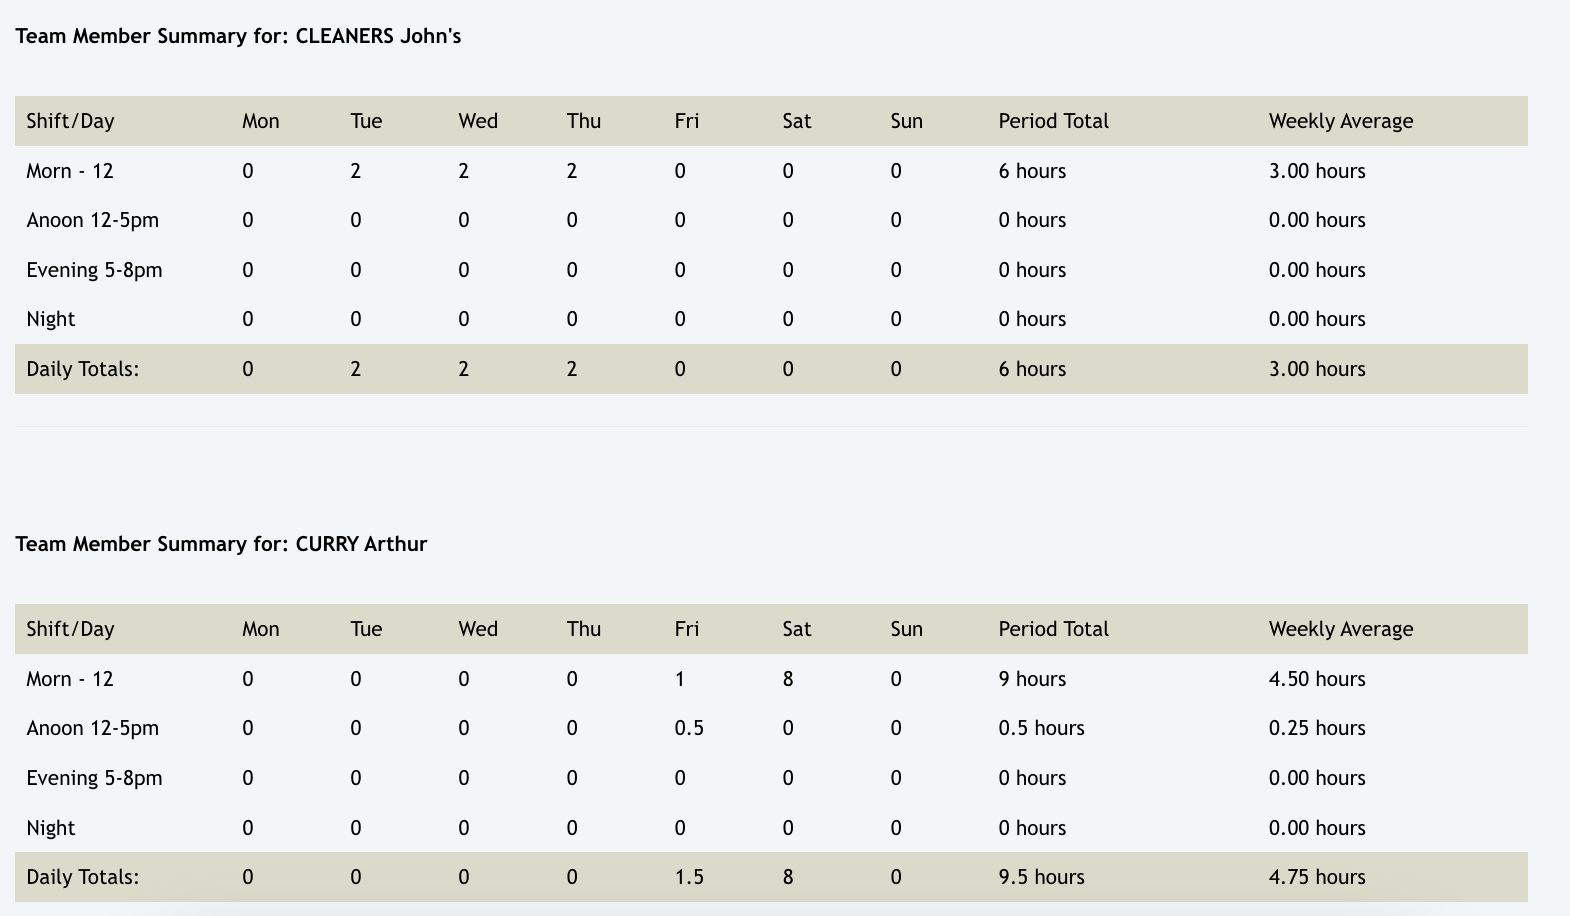
Below is a summary report for each care worker on a certain period of time.
Move on to Service Summary to learn how to create report detailing on the services provided.