Overview
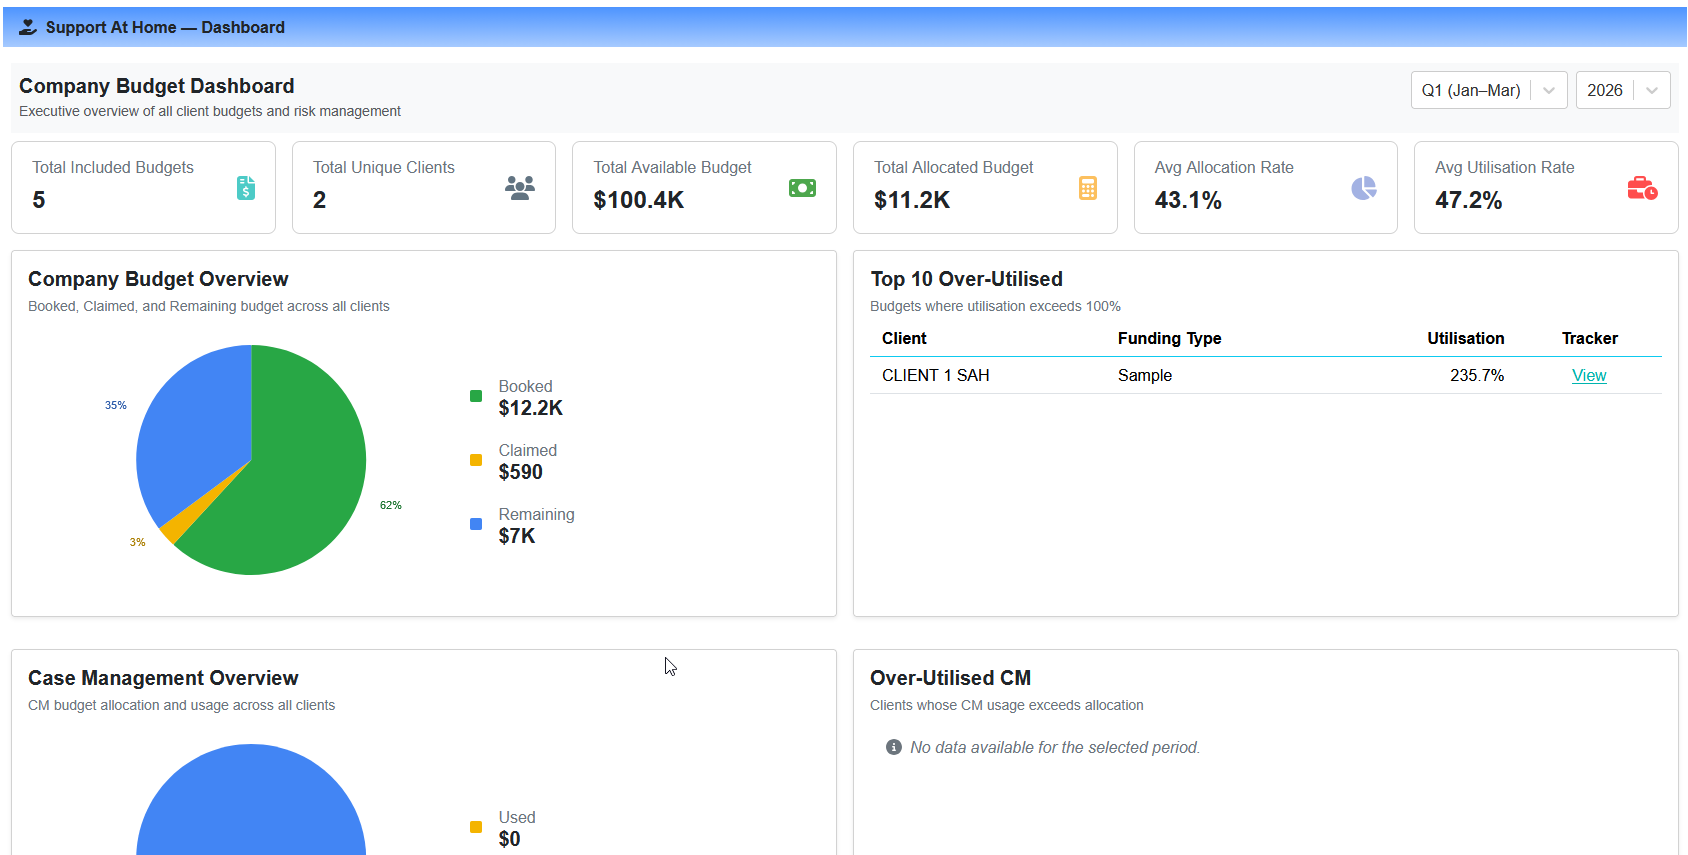
The SAH Budget Dashboard gives coordinators and managers a company-wide view of budget performance across all active Support at Home clients for a selected quarter and year. Rather than viewing each client's budget individually, the dashboard aggregates key metrics to surface trends, highlight at-risk budgets, and provide case management reporting in one place.
To access the dashboard, navigate to Support at Home → Dashboard and select the Budgets tab. Use the quarter and year selectors at the top to choose your reporting period.
Summary Statistics
The top of the dashboard displays four summary cards:
Total Clients — the number of unique clients with an active budget in the selected quarter
Total Budget Value — the combined available budget across all active clients
Average Utilisation Rate — the mean utilisation percentage across all active budgets
Active Alerts — the number of budgets exceeding the utilisation alert threshold
Company Budget Overview
A pie chart showing the aggregate split of Booked, Claimed, and Remaining values across all active budgets in the selected quarter. This mirrors the overview on individual budget trackers but rolled up to the company level.
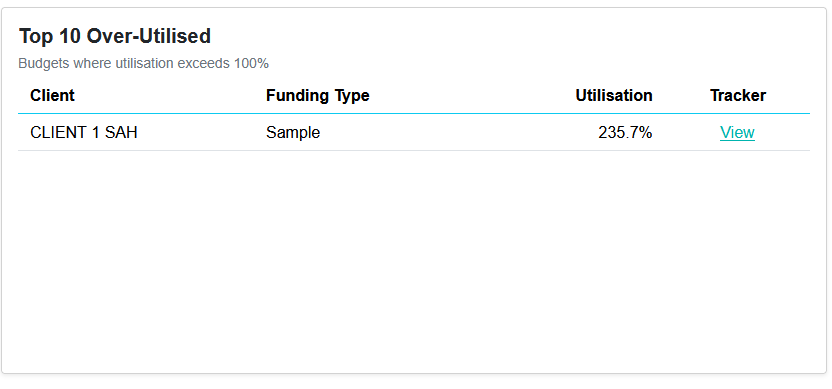
Top 10 Over-Utilised Budgets
A table listing the ten budgets with the highest utilisation percentage. Each row shows the client, funding type, and utilisation rate, with a direct link to that client's individual budget tracker for further detail.
Case Management Reporting
The lower section of the dashboard focuses on Case Management (CM) spend:
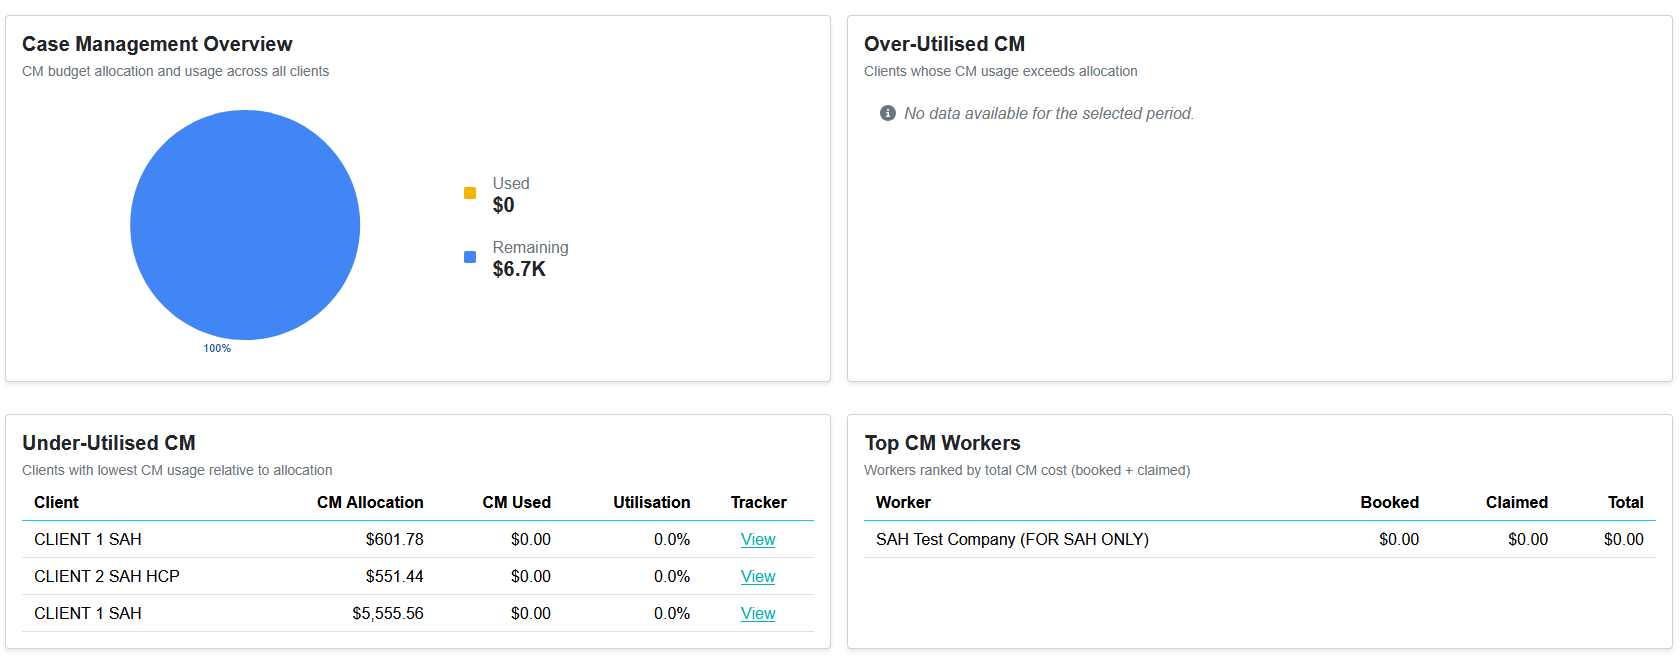
Case Management Budget Overview
A pie chart showing the aggregate Case Management available, claimed, and remaining amounts across all active budgets. Case Management is calculated as 10% of each client's total budget, consistent with the individual budget tracker.
Over-Utilised Case Management
A list of clients whose Case Management spend has exceeded their allocated CM amount. Shows the client name, allocated amount, amount used, and utilisation percentage.
Under-Utilised Case Management
A list of clients who have used the least of their Case Management allocation, sorted ascending by utilisation percentage. Useful for identifying clients who may benefit from additional coordination support.
Case Management Workers
A breakdown of Case Management activity by worker, showing total claimed, number of clients supported, and average CM spend per client. This helps managers understand how CM hours are distributed across the team.